Unlock Deeper Insights: Master Multiple Time Frames with a Multi-Monitor Setup
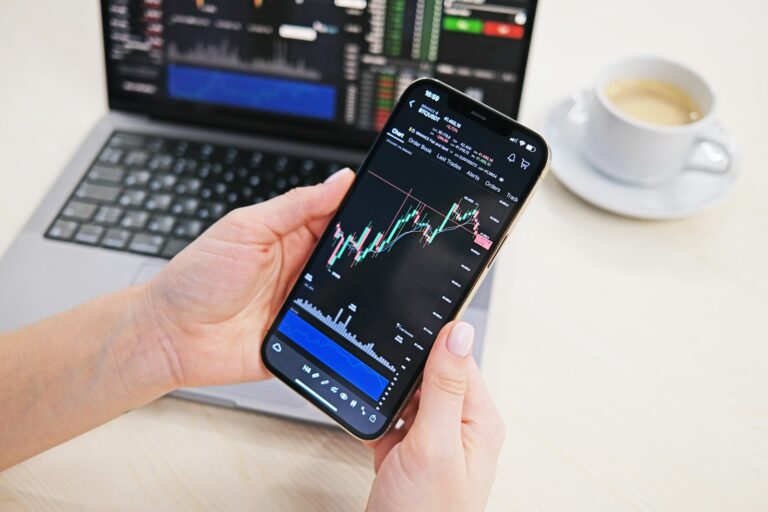
Ever felt like you’re missing part of the market’s story? Like you’re only seeing a snapshot when you need the whole movie? For traders and investors, understanding the market’s rhythm across different time frames is paramount. And for those serious about their analysis, a multi-monitor setup isn’t just about looking professional – it’s a game-changer for mastering this critical concept.
Imagine simultaneously tracking the immediate pulse of the market, the developing short-term trends, and the overarching long-term direction, all without clicking between tabs or losing your place. This is the power of integrating multiple time frame analysis with a multi-monitor workstation.
Why Multiple Time Frames Are Your Trading Superpower
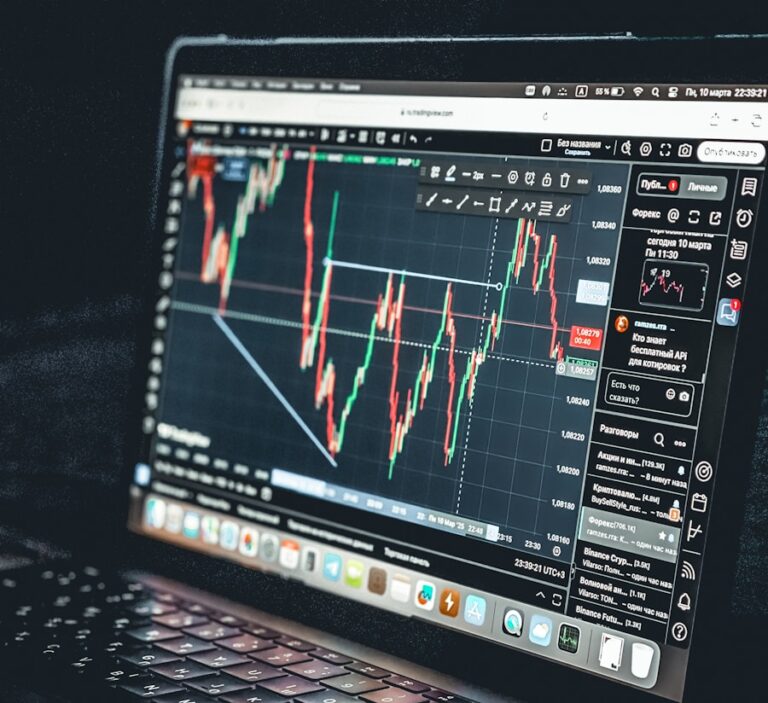
Think of a single stock chart like a single frame from a film.
- A 1-minute chart shows you every tiny flicker of action – the whispers and shouts of immediate buying and selling.
- A 1-hour chart reveals the unfolding scenes, the short-term narrative.
- A daily chart gives you the full arc of the story, the main plot points.
If you only look at one, you risk misinterpreting the situation. A stock might be skyrocketing on a 5-minute chart, but if it’s hitting major resistance on the daily chart, that short-term rally might be a trap. Conversely, a brief dip on a 15-minute chart might be an excellent buying opportunity if the weekly trend is strongly bullish.
The core idea:
- Longer time frames provide context, identifying major trends, support, and resistance levels. They tell you the direction of the river.
- Shorter time frames pinpoint entry and exit points, showing you the ideal spot to jump in or out of the river.
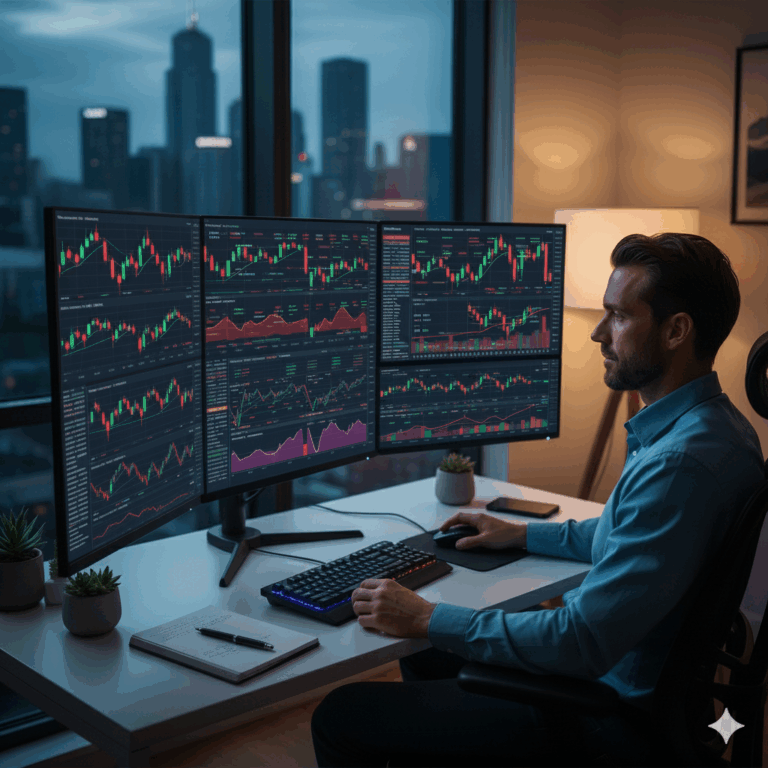
The Multi-Monitor Advantage: See It All, All at Once
This is where your extra screens become indispensable. Instead of constantly toggling between different charts on a single monitor, you can dedicate each screen (or sections of a screen) to a specific time frame.
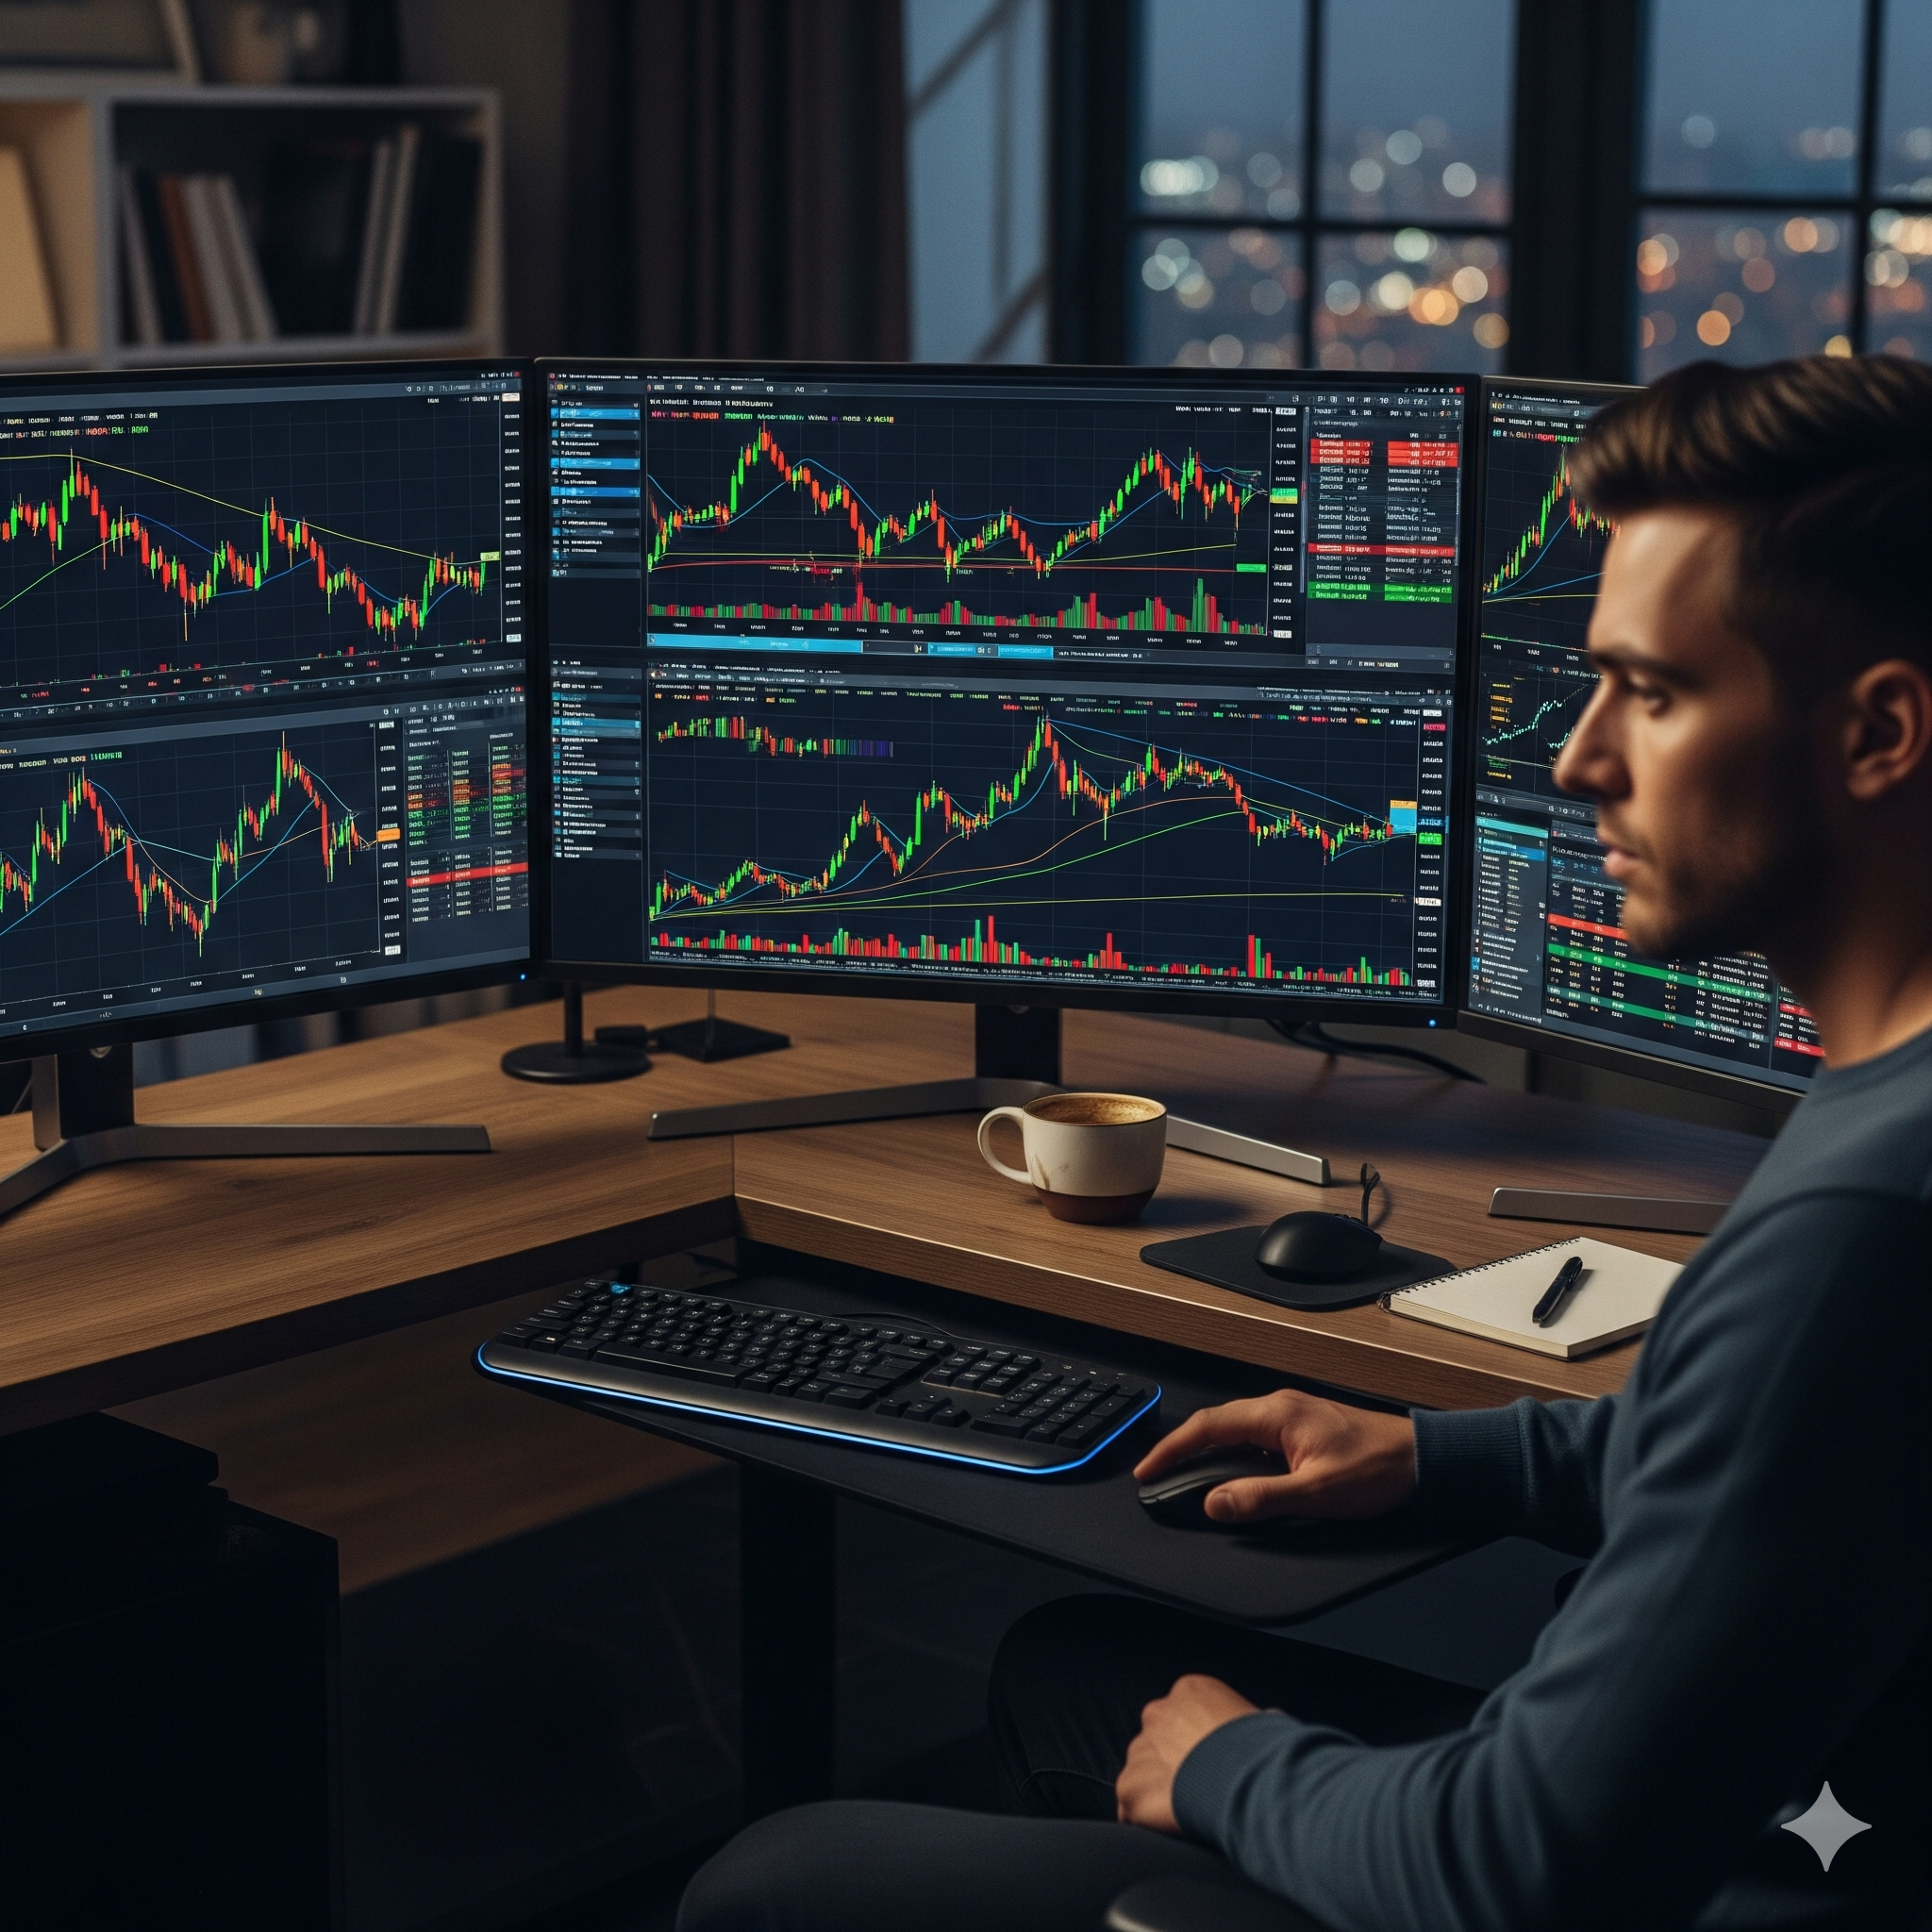
Here’s how a typical setup might look and why it’s so effective:
Monitor 1: The “Big Picture” – Daily & Weekly Charts
- This screen is for your strategic overview. You’ll keep daily and weekly charts of your watch list here.
- What you’re looking for: Major trends, significant support and resistance zones, long-term indicators (like 200-day moving averages), and overall market sentiment. This helps you understand the prevailing wind.
Monitor 2: The “Tactical View” – Hourly & 30-Minute Charts
- This is where you refine your understanding of the developing trends. You might place hourly and 30-minute charts of stocks you’re actively considering.
- What you’re looking for: Emerging short-term trends within the context of the longer trend, breaking of minor support/resistance, and early signs of momentum shifts. This helps you see how the tide is turning.
Monitor 3 (or a section of Monitor 2): The “Execution Zone” – 15-Minute, 5-Minute, or 1-Minute Charts
- This screen is for precision. When you’re ready to enter or exit a trade, you zoom in here.
- What you’re looking for: Confirmation of entry/exit signals, specific candlestick patterns, volume spikes, and indicators confirming short-term momentum. This tells you the exact wave to catch.
Practical Tips for Your Multi-Monitor Setup
- Consistency is Key: Use the same indicators, chart types (e.g., candlesticks), and color schemes across all your time frames for easier comparison.
- Link Your Symbols: Most trading platforms allow you to “link” charts. This means when you change the stock symbol on one chart, all linked charts on your other monitors will update automatically. This saves immense time.
- Consider Vertical Monitors: For daily and weekly charts, a vertically oriented monitor can display more historical price action at a glance, making it easier to spot long-term patterns.
- Declutter: While you have multiple screens, avoid information overload. Only display what’s essential for your analysis.
- Ergonomics: Invest in a comfortable chair and monitor arms to position your screens optimally. You’ll be spending a lot of time looking at them!
Beyond Just Charts: Integrate Your Workflow
Your multi-monitor setup can do more than just display charts. Dedicate a screen (or part of one) for:
- News Feeds: Real-time financial news can act as a catalyst, and seeing it instantly can give you an edge.
- Order Entry: Keep your broker’s order entry platform readily accessible for quick execution.
- Market Scanners: Run live scans for volatile stocks, unusual volume, or specific technical patterns.
Conclusion: See More, Trade Smarter
A multi-monitor setup, when combined with a disciplined approach to multiple time frame analysis, transforms your trading environment. It allows you to see the market’s story unfold from macro to micro, enhancing your ability to make informed decisions and ultimately, giving you a significant advantage in the dynamic world of trading.
Stop squinting and start seeing the full picture. Your trading desk (and your portfolio) will thank you.