
Beyond the Basics: Building Your Ultimate Trading Toolbox
A Trader’s Toolkit: Essential Instruments for Market Analysis
Every successful trader knows that having the right tools is crucial for navigating the financial markets. Whether you’re a beginner or an experienced professional, a solid understanding of these key instruments can dramatically improve your analysis and decision-making.
Here is a breakdown of the most popular and effective trading tools, categorized to help you build your ultimate trading toolkit.
Technical Indicators: The Foundation of Your Strategy
Technical indicators are mathematical calculations based on historical price, volume, and open interest data. They are the backbone of most quantitative trading strategies.
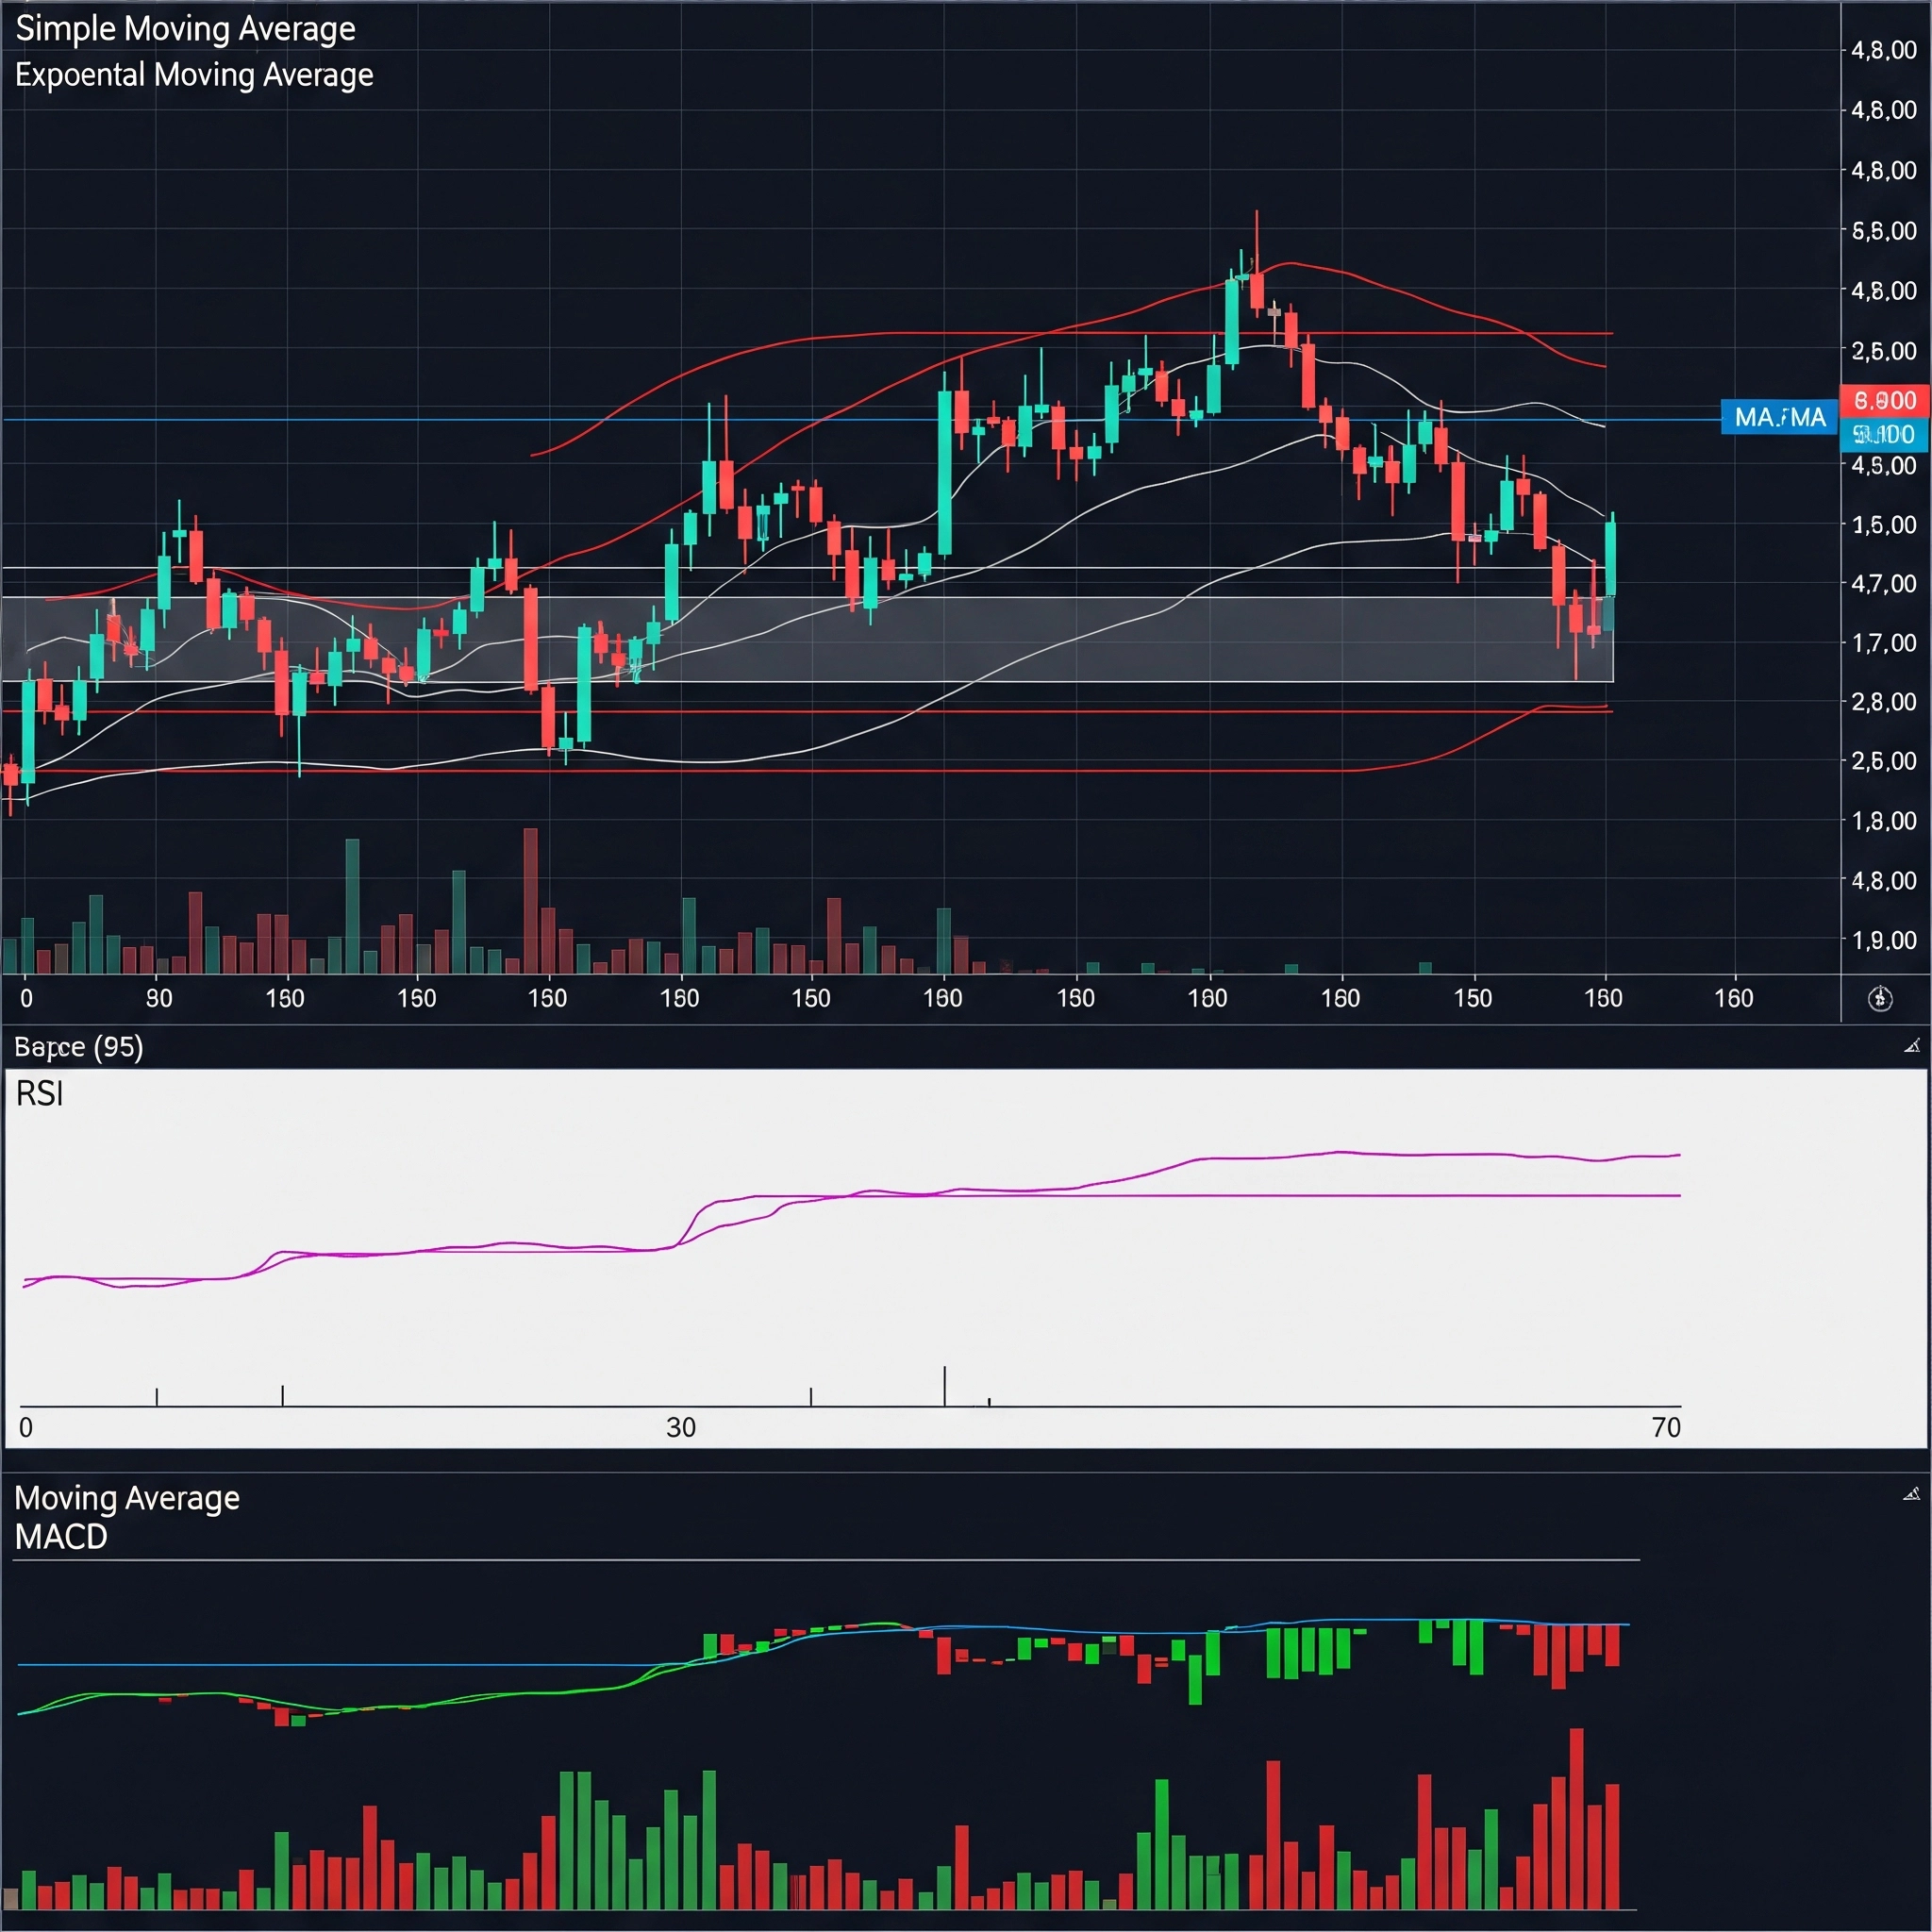
- Moving Averages (MA & EMA): These are fundamental tools for identifying the direction and strength of a trend. They smooth out price data, helping you see the underlying trend more clearly. A fast-moving average (like the 20-period EMA) crossing a slow-moving average (like the 50-period MA) can signal a change in trend.
- Relative Strength Index (RSI): This is a powerful momentum oscillator that helps you find overbought and oversold conditions. A reading above 70 typically suggests an asset is overbought and may be due for a pullback, while a reading below 30 can signal it is oversold.
- Bollinger Bands: These bands consist of a simple moving average and two outer bands that represent standard deviations. They are excellent for measuring volatility. When the bands are close together, it indicates low volatility, and when they are far apart, it suggests high volatility. Price often tends to revert to the middle line.
- Moving Average Convergence Divergence (MACD): This trend-following indicator shows the relationship between two moving averages. It’s often used to identify changes in momentum, trend direction, and potential reversals.
Charting and Price Action Tools: Reading the Market’s Story
While indicators are essential, a deep understanding of price action—how price moves over time—is what truly sets traders apart. These tools help you read the story the market is telling.
- Candlestick Charts: The most popular chart type, candlesticks provide a rich visual representation of an asset’s price movement over a specific period, showing the open, high, low, and close. Learning to recognize common candlestick patterns (like hammers or engulfing patterns) can help you predict future price moves.
- Support and Resistance Levels: These are key price levels where an asset’s price has historically struggled to move through. Support is a price level where a downtrend is expected to pause due to a concentration of demand, while resistance is a price level where an uptrend is expected to pause due to a concentration of supply.
- Trendlines: By connecting a series of highs or lows on a chart, you can draw a trendline to help identify the direction of a trend. A break of a key trendline can signal a potential reversal.
- Fibonacci Retracements: Based on the mathematical series, these tools help identify potential support and resistance levels during a price pullback. Many traders use them to pinpoint optimal entry or exit points within a trend.
Trading Platforms: Your Gateway to the Markets
Your trading platform is your mission control. It provides the interface for charting, analysis, and order execution.
- TradingView: A top choice for its powerful web-based charting, extensive indicator library, and active social community. It’s perfect for both beginners and experienced traders.
http://www.tradingview.com
- NinjaTrader: delivers integrated multi-device trading using a cloud-based technology designed for active futures traders. Take control of your trading journey and trade how you want, where you want.
https://ninjatrader.com - MetaTrader (MT4 & MT5): The industry standard for forex trading. It’s renowned for its stability, support for automated trading (Expert Advisors), and a vast library of custom indicators.
https://www.metatrader5.com/en
- Thinkorswim (TD Ameritrade/Charles Schwab): A robust, all-in-one platform known for its sophisticated charting, extensive research tools, and excellent paper trading feature for practicing your strategies.
https://www.schwab.com/trading/thinkorswim
By combining a strong understanding of technical indicators, price action, and a reliable trading platform, you can build a powerful toolkit that will help you make more informed decisions and navigate the markets with confidence.